
Operational metrics and key performance indicators (KPIs) are essential tools for measuring business performance and helping ensure that processes are running efficiently across departments. This guide explores the different types of operational metrics and KPIs, how to track them effectively, and best practices for improving overall performance.
What are operational metrics and KPIs?
Operational metrics are quantifiable measurements used to track, assess, and analyse business progress. They typically measure the performance of an individual department, such as finance, sales, marketing, supply chain, and HR.
KPIs are typically more strategic, tracking the efficiency and effectiveness of a company’s day-to-day activities and processes across departments working toward the same goals.
By tracking operational metrics and using them to inform specific KPIs, businesses can gain a greater understanding of the quality and effectiveness of their processes and accurately assess productivity levels across all departments.
Importance of operational metrics and KPIs
Operational metrics and KPIs provide important data that allows businesses to measure their performance and progress. After analysing operational metrics to pinpoint areas of weakness, organisations can shift their allocation of resources, modify their processes, and take other steps to improve performance.
Types of operational metrics and KPIs
Different categories of operational metrics serve different purposes, including those that cover:
- Efficiency, to identify areas for improvement, such as average sales length, inventory turnover rate, output per worker, and employee absence rate.
- Financial performance, to determine how the business is doing compared with established goals such as return on sales, gross profit margin, operating cash flow, and working capital.
- Capacity, to assess an organisation’s ability to handle current and future demand. Metrics in this area include capacity utilisation ratio, order fill rate, and resource utilisation rate.
- Availability, to determine the reliability of systems and services and predict how they’ll perform in the future. Metrics here include system/service uptime and mean time to recover (MTTR).
The most important types of operational metrics and KPIs for your organisation may depend on its industry. For example, manufacturing companies often prioritise tracking throughput and capacity utilisation to make sure production targets are met, while software-as-a-service companies are likely to pay particular attention to metrics and KPIs associated with uptime and MTTR.
The operational metrics and KPIs your organisation relies on will also differ across departments and depend on which industry it’s in. The next section goes into examples.
How to calculate key operational metrics and KPIs
Here are some key metrics by department and industry:
-
Marketing
-
Return on advertising spend (ROAS): the amount of revenue made per dollar spent on advertising which generated that revenue.
Revenue attributable to ads / Cost of those ads = Return on advertising spend
-
-
Retail
-
Average order value (AOV): how much customers spend in a single purchase, on average.
Total sales / Total transactions = AOV
-
-
Human Resources
-
Employee turnover rate: how many workers leave a business over a certain time period.
[Number of employees who left in a given period / Average number of employees] x 100
= Employee turnover rate
-
-
Sales
-
Customer churn rate: how many customers cease doing business with a company over a certain time period.
[(Customers at start of a given period - customers at end) / Customers at start] x 100
= Customer churn rate
-
-
IT
-
Ticket response time: how long it takes for IT support people to respond to requests for assistance.
Total time elapsed between report and response / Number of reports = Ticket response time
-
How to track and analyse operational metrics and KPIs
Tracking and analysing operational metrics and KPIs can involve many steps and incorporate data from multiple sources. However, a few steps are likely to be relatively consistent. These include:
-
Identifying appropriate metrics and KPIs. It’s typically best to begin the process by deciding which operational metrics and KPIs to track. When selecting your metrics and KPIs, important things to consider include:
- The key business objectives you want to achieve. Focus on business objectives and goals that are aligned with your company’s stage of growth, and select the relevant metrics that will allow you to assess progress toward those goals.
- The timeframes for your business objectives. Select operational metrics and KPIs that relate to both your organisation’s short- and long-term objectives and goals to give a balanced view of business performance.
- Metrics that are relevant to different departments. Get the backing of your entire organisation by consulting with departments about useful metrics. Choose a balance of qualitative and quantitative measures.
-
Gathering the relevant data. After you’ve picked the operational metrics, use an enterprise resource planning (ERP) system to gather them into a dashboard for use in comparing against KPIs. ERP systems take data from disparate sources and consolidate it into a single database, which feeds into dashboards that provide an instant view of the chosen operational metrics.
Use dashboards to visualise performance in areas such as accounting, supply chain, sales, marketing, and HR. For example, Australian not-for-profit consumer advocacy organisation CHOICE gained a single view of each subscriber across multiple platforms using NetSuite ERP, helping the organisation deliver more efficient customer support.
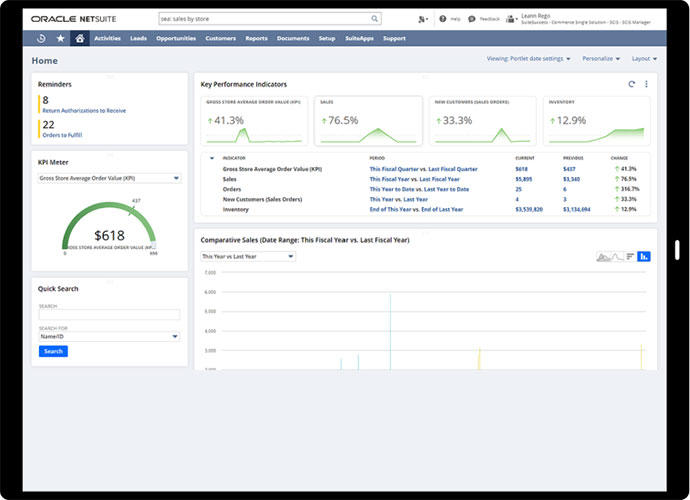
NetSuite ERP's commerce-focused dashboard - Comparisons to KPIs, benchmarks, and goals. Once you’ve got a business dashboard set up, you can compare the performance of the operational metrics to KPIs that reflect your organisation’s established goals or industry benchmarks.
-
Taking a deeper dive. If certain organisational objectives aren’t being met, the next step is to dive deep into the specific metrics related to these KPIs and the goals behind them. Business dashboards make it easy to identify the elements of your operations that may need closer attention.
For example, if business growth is plateauing, you might look at your dashboard to note any changes to operational metrics such as average order value, return on advertising spend, and lead conversion rate. These insights can shine a light on any specific issues with your marketing or sales processes and prompt you to make changes accordingly.
Best practices for improving operational metrics and KPIs
To see notable improvements in operational metrics over time, organisations need to regularly monitor their dashboards, analyse the numbers, and build processes and systems that drive improvements.
Australian tech consulting firm Ampion uses NetSuite ERP dashboards to help ensure that data around timesheets, invoicing, financials, and other processes is properly captured, synchronised, and harnessed. With a complete view of the business, Ampion can focus on improving performance to deliver excellent service to clients.
Track your operational metrics and KPIs with NetSuite
NetSuite ERP helps organisations effectively track operational metrics and KPIs through a unified, cloud-based platform. The data analytics and reporting tools of NetSuite SuiteAnalytics give organisations up-to-date metrics relevant to their operations on customised dashboards.
Operational metrics and KPIs FAQs
What are the KPIs for operational excellence?
KPIs for operational excellence include customer satisfaction, employee productivity, and resource utilisation rate.
What are operational KPIs?
Operational KPIs are measures of how effectively a company carries out its routine activities. They’re essential to measuring whether businesses are managing their costs effectively and limiting unnecessary time, materials, and labour wastage.
How do businesses set operational KPIs?
The first step in setting operational KPIs is to ensure they’re aligned with organisational goals. It’s also important that the data which feeds these KPIs be easy to collect and organise, and that the KPIs are tracked at regular intervals.
What is the difference between a strategic KPI and an operational KPI?
Strategic KPIs are used as high-level indicators of how a business is performing in relation to its long-term goals. Operational KPIs are more focused on tracking everyday operations in real time. Shifts in strategic KPIs usually happen gradually, while operational KPIs are likely to change on a more regular basis.