An accurate inventory forecast is invaluable, especially in times when supply chains and consumer demand are changing rapidly. Getting forecasts right requires a mix of statistical and mathematical data analysis, experience with the business, customer insights and a little crystal-ball gazing to predict factors that could cause a dip or spike in future demand.
After all, it’s the age of Tik-Tok. A surprise product placement by an influencer could clear out your stock in seconds.
Some factors are major, some peripheral. Some could make an entire season, while some have only a mild effect. Essential data elements required for accurate inventory forecasting include: current inventory levels, outstanding purchase orders, historical trendlines, forecasting period requirements, expected demand and seasonality, maximum possible stock levels, sales trends and velocity and customer response to specific products.
On a strategic level, forecasters need insights into organisational goals, local or global supply chain challenges, planned marketing pushes and campaigns, potential media influences—such as that celebrity endorsement—and the competitive landscape.
What Is Inventory Forecasting?
Inventory forecasting, also known as demand planning, is the practice of using past data, trends and known upcoming events to predict needed inventory levels for a future period. Accurate forecasting ensures businesses have enough product to fulfil customer orders and do not spend too little or too much on inventory.
Note that this isn’t the same as deciding when to reorder.
Inventory forecasting vs. replenishment: Inventory forecasting is calculating the amount of inventory necessary for future periods. It factors replenishment data such as timing, availability and delivery speed—also known as lead time. Replenishment is the stock required to meet inventory forecasts based on inventory goals, supply and demand.
What Are the Types of Inventory Forecasting?
Even though, to some degree, “gut feelings” and experience play a role, all forecasting is formulaic at some point. The question is, which method is best for your needs?
The main formulaic methods for successful inventory forecasting are trend, graphical, qualitative and quantitative. The expert tasked with forecasting chooses the best method based on known stocking issues, personal insights, feedback from sales, customer input, mathematical analysis and market research.
Each of the following forecasting methods uses a different formula:
Trend forecasting: Trends are changes in demand for a product over time. This method projects possible trends and excludes seasonal effects and irregularities using past sales and growth data. More-granular sales data helps this forecasting technique by showing how specific customers as well as types of customers will likely purchase in the future. Analysts can find new ways to market and offer sales from this data.
Graphical forecasting: The same data that a forecaster looks at mathematically in trend forecasting can be graphed to show sales peaks and valleys. Some forecasters prefer the graphical method because it is visual. They can discern patterns from a series of data points and add sloped trend lines to graphs to examine possible directions that might otherwise be missed.
Qualitative forecasting: When they lack historical data, some companies go straight to the source: their customers. Qualitative forecasting often involves complex data collection, such as focus groups and market research. Forecasters then flesh out models from this type of data.
Quantitative forecasting: Considered more accurate than qualitative research alone, quantitative forecasting uses past numerical data. The more past data a company has, the more precise the forecast usually is. One example of quantitative forecasting is time-series forecasting, which uses temporal quantitative data to make a model. This model helps to predict future trends.
Award Winning
Cloud Inventory
Free Product Tour
How to Choose the Right Forecasting Method
First, consider what data you have available and what you can collect. The process won’t be the same for all organisations: Established companies should start with historical data and use the quantitative approach. For newer companies, start by collecting qualitative market information.
The best forecasting uses a mix of methods and data types. Quantitative data gives modelers a place to start. Adding qualitative data fleshes out the model. Use industry-specific inputs to complete forecasting.
The trick is in making sure the model reflects wild cards—those ever-changing and often unpredictable trends and market upsets that can shift demand in an instant. In smaller blips, such as changes in fads, market research can help drive supply. To address more significant challenges, such as a global pandemic, statisticians should develop multiple models based on historical information and different plausible scenarios, possibly working with scenario planning teams.
Forecasters may also incorporate extreme-need scenarios to determine possible demand.
Inventory Forecasting Benefits
Inventory forecasting can mean the difference between profitability and piles of unsold goods. When used correctly, companies can better plan for potential trends, save money on storage and keep customers happy.
12 Top Payoffs
While launching a forecasting practice takes effort around data gathering and scenario planning, it pays off in a variety of ways. |
||
|---|---|---|
COST SAVINGS |
CUSTOMER & SUPPLIER SATISFACTION |
|
|
|
|
BACK-END IMPROVEMENTS |
STRATEGIC INSIGHTS |
|
|---|---|---|
|
|
How Does Inventory Forecasting Work?
Inventory forecasting works by helping companies strike a balance between having too much cash tied up in inventory and having enough stock to meet demand. The three main pieces to this calculation are forecast period, base demand and application of variables and trends.
For the forecast period, the further out a company goes, the less likely the forecast is realistic. This uncertainty is due to fluctuations in the market, current events and scientific risk. Standard intervals include 30 days, 90 days and one year. A one-year forecast interval accounts for seasonal fluctuations. Review any forecast that covers more than one month. Adjust to account for differences in sales and market trends.
Base demand is the known customer need when a statistician develops a forecast. Usually, it uses the prior 30 days of sales or any presales.
The application of variables and trends is the squishier part of forecasting. Some analysts have a recipe for this; they may look at global or even local influences and marketing pushes. These include sales velocity, supply chain challenges and seasonality. Each industry has unique variables that analysts must account for when demand planning.
16 Steps to Succeed at Inventory Forecasting
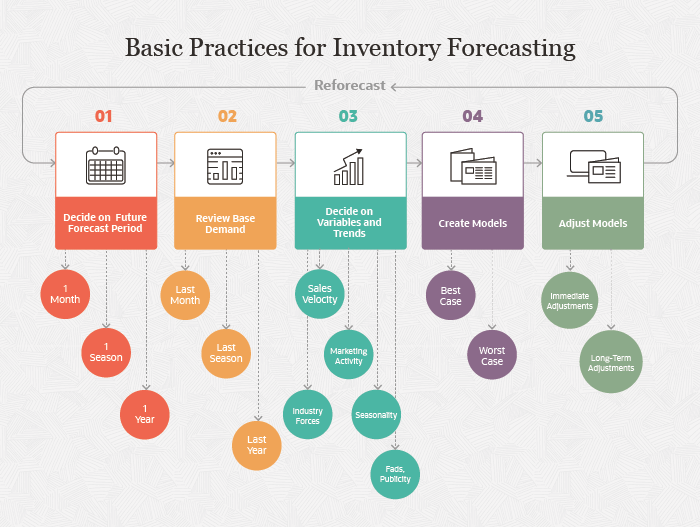
Follow these basic steps to perform an inventory forecast:
- Decide on a future forecast period, such as 30 days, 90 days or one year.
- Review the base demand for the period. For example, if the company sold 500 units in the last period, the starting data point will be 500 units for the forecasting model.
- Decide on trends and variables and their effect on an increase or decrease in sales, such as any promotions or outlying marketing activity that may have affected the baseline demand.
- Review the sales velocity. Sales velocity is how fast sales move through the company pipeline. It is based on the number of leads, average deal value, conversion rate and the sales cycle length.
- Review marketing activity. Planned marketing events can give sales of products a temporary boost.
- Review any pertinent industry forces, such as new competitors in the marketplace, supplier issues, commercial buyer behaviour, threats of less expensive product substitutes and other competitive rivalries.
- Review seasonality as it affects each product. There are many ways to determine seasonality, including calculating a seasonal index for each month, spreading the demand over 12 months or using more complex statistical methods.
- Include possibility of fads or unpaid publicity, including social. Since these can happen randomly or without seeming reason, many inventory supply experts can’t predict these jumps in sales. Working with marketing staff who may have insight can help you plan for additional stock.
- Create the models. Often, this science is more of an art that’s based on all the collected trends and historical knowledge. You’ll use this information to build the models for forecasting. There are many statistical techniques, as we discussed. Which you choose depends on the stability of the product demand.
- Clean the data by removing unusual or outlier data points and deciding if there is missing information. If so, can you get it, or is it OK to proceed anyway?
- Identify either a parametric or nonparametric statistical approach.
- Process the data by loading it or arranging it in a datasheet appropriate for the algorithm.
- Estimate the model parameters: which is the best and worst case for the data points?
- Validate the model(s). Use different data than what you used to calibrate the model.
- Adjust the model regularly or when events require that you do so. Remember, this is a forecast based on assumptions. Real-life can show it to be off base, so you may need to adjust the parameters.
- Reforecast.
Calculate sales velocity with this formula:
Sales velocity (SV) = [(# of leads) x (average deal value) x (% conversion rate)] / (sales cycle length)
For example, imagine a scenario where your company has 20 opportunities to sell a product. The percent of these opportunities that usually get turned into a sale is about 50%. The average deal size is $5,000, with a sales cycle length of three months. Sales velocity is [(20 x .50 x $5,000)/90 days] = $555.56. This number means that the product is bringing in about $556 per day in revenue.
Trends and Variables
Some trends and variables are common in forecasting. For example, when a celebrity wears a garment, the fashion industry expects jumps in demand for similar products. This event is not an outlier but anticipated, and it often comes with a plan. This coincides with product launches and restocking.
An outlier in the fashion industry was an unexpected extreme demand for casual wear during the 2020 quarantine, in response to the number of people working from home. Many companies had to react quickly to supply shirts suitable for video calls and pants with elastic waistbands. Meanwhile, demand for dress shoes plummeted.
Glossary: Inventory Forecasting Lingo
There are some terms you’ll need to know to make sense of inventory forecasting, including reorder point, stock outs, safety stock and lead time demands.
What is reorder point? The reorder point (ROP) is the stock level that triggers replenishment in an inventory management system. Accountants can manually plan reorder points. Demand planning software is particularly helpful for avoiding stock-outs by ordering the right items at the right time.
Reorder point formula: The reorder point formula is a trigger for companies to replenish a product. It is the daily usage in units, combined with the days of lead time necessary for replacement, combined with the units of safety stock.
Use this formula to calculate reorder point:
Reorder point = (# units used daily x # days lead time) + # units safety stock
For example, imagine a scenario with 100 units sold or used per day, a five-day reorder delivery and a safety stock level of 75 units. ROP = (100 x 5) + 75 = 575. When inventory falls below 575 units, the company reaches the reorder point and must reorder stock. For a more conservative estimate, ignore the safety stock in the calculation.
How to determine optimal reorder point: Determine the optimal reorder point by calculating ROP. This ensures your business stays abreast of industry and world events. These situations can change how and when customers order products. Check and adjust forecasts and ROP at specified intervals.
Stock-outs: Stock-outs are when customer demand for a specific product exceeds the inventory a business has on hand. The danger of stock-outs is that companies can lose otherwise faithful long-term customers to the competition.
Safety stock: Safety stock is extra product inventory kept in storage as a buffer against stock-outs. Calculate safety stock by subtracting historical data on maximum usage and average daily usage. Some analysts also conservatively include the company’s desired service level.
Lead-time demand: Lead-time demand is the time it takes for suppliers and manufacturers to deliver products compared to when they ordered it. Businesses account for the delay from lead time in their reorder point formulas.
Learn more about the formulas you need to get actionable metrics.
Inventory Forecasting Formulas
Inventory forecasting formulas also focus on ensuring companies have the right amount of stock. There are simplistic formulas, such as inventory turnover. There are also more complex formulas and methods in forecasting, such as using regression analyses and multifactorial models.
Formulas are an important part of forecasting. Examples of formulas include EOQ, ROP, lead time, average inventoryand safety stock. These are important concepts to understand to build out more complex models for forecasting.
For example, EOQ is the initial planning formula, and the ROP accounts for stock replenishment.
EOQ is the ideal order quantity during regular times. Use this formula to calculate EOQ:
EOQ Formula
The formula for EOQ is:
| EQQ Formula | |
|---|---|
|
EOQ = √2DS/H, where
|
|
For example, imagine a scenario where a retail store sells 500 sets of gloves every year on average. Gloves are small items, so it only costs the store $1 per year to hold each set of gloves in stock. The fixed cost to order more gloves is $4. EOQ = √[(2 x 500 x $4)/$1] = 63.2. The ideal order size is slightly more than 63 sets of gloves.
Setting Forecasting Boundaries
Set forecasting boundaries to ensure that analysts use reasonable and probable logic. Forecasting boundaries should account for outliers, but minimise those with a very low probability of happening—they often have significant financial impacts.
In fact, seasonal trends can be some of the trickiest to account for. But new products and replenishments are also challenging.
Forecasting for seasonal products: Forecasting for seasonal products is the most challenging type of planning. Analysts use historical demand data and sales figures. They also add more timely and subjective data to their models, such as expected weather and marketplace trends.
One way to account for seasonality is to use the seasonal index formula. The seasonal index formula is a measure of the seasonal variation as compared with that season on average. The seasonal index takes away seasonality and smooths out the data. There are multiple methods to calculate the seasonal index.
One method to calculate seasonal index is to use the simple averages method. The steps are as follows:
Step 1: Arrange the data in seasons (3-month intervals, i.e., Q1, Q2, Q3, Q4 or Fall, Winter, Spring, Summer months).
Step 2: Calculate the season totals and the season averages. In the example below, the season total for Q1 is the sum of all Q1s for the years 2015-2018. The season average for Q1 is the season total/4.
Step 3: Calculate the grand average. In the example below, the grand average is the sum of Q1-Q4 season averages.
Step 4: Calculate the season index. In the example below, calculate the seasonal index for each season by:
Seasonal index (%) = (seasonal average/grand average) x 100
Use the seasonal indices in a graph or time-series analysis to project a trend line for forecasting.
Year Sales Organised by Season for Seasonal Indices Analysis
| Q1 | Q2 | Q3 | Q4 | ||
|---|---|---|---|---|---|
| 2015 | $4,520 | $2,300 | $2,270 | $3,400 | |
| 2016 | $5,230 | $2,100 | $2,900 | $3,700 | |
| 2017 | $5,340 | $2,700 | $2,500 | $4,010 | |
| 2018 | $5,020 | $3,000 | $2,600 | $4,600 | |
| Season Totals | $20,110 | $10,100 | $10,270 | $15,710 | Grand Average |
| Season Average | $5,028 | $2,525 | $2,568 | $3,928 | $3,512 |
| Season Index | 143% | 72% | 73% | 112% |
Forecasting for new products: Demand for new products can also be challenging to forecast. Analysts include data on similar existing products as well as qualitative data and tailor models to reflect clusters of products with similar lifecycle curves from which to draw assumptions.
Inventory forecasting models should also account for promotional events. Some software systems build promotions, like tax season or back to school, into their forecasting. They may also use past sales history, seasonal modelling and the dates of the promotions.
Inventory planning and replenishment: You can reorder or replenish inventory automatically or manually. The above formulas and models can inform the optimal amount of stock to keep on hand, as well as the number of items to order and how often to order them. As discussed, supplier glitches, transportation issues and seasonal variances may delay replenishments. Decide whether reordering should be manual or automated with an inventory control system that places orders on a predetermined schedule. If it’s a manual process, who will be responsible for placing the order?
Inventory Forecasting Examples
There are a number of examples of solid inventory forecasting models. The most prominent formulas are EOQ and ROP. Excel also includes a Forecast function that calculates the statistical value of a forecast using historical data, trend and seasonality assumptions.
Dan Sloan, NetSuite technology consulting manager for accounting firm Eide Bailly, describes one example of forecasting he performed in 2014 for a consumer goods company where he worked.
“They were bringing in products for their fourth-quarter peak season sales,” he said. “The CEO and supply chain director were playing close attention to the labour situation on the Long Beach port and realised that a strike was imminent. They accelerated orders to bring in the product earlier. Since we had a sophisticated demand planning engine in place, it was easy to extend the lead times of those shipments and order them in time to beat the anticipated strike.
“These actions led to a huge win, as their competitor’s containers were held up in the port and missed the crucial two weekends before Christmas. Not only did this lead to record sales, but it provided a competitive advantage in terms of market share going into the next year.”
Sloan’s model for this company included qualitative data, so awareness of local news was important. The platform the company used also enabled them to pivot quickly and order additional products.
Another example is of an electronics company that wanted to gain more market share for its mobile device. Before this, the company used only industry sales data from other companies and did little market research to forecast inventory needs. It usually ended up with too little or too much inventory—and not in the right geographical regions. Customers got frustrated when there were stockouts, creating the potential that disgruntled shoppers would decamp to competitors. When the company had too much inventory, it took a financial hit when the product became obsolete.
Better forecasting for this company came in the form of qualitative focus group data and base demand (for this specific company) spread by region. The company also began communicating with marketing about planned events, which enabled the team to consider factors such as employment rates and housing trends by region for specific market identification.
A convenience store is a smaller-scale example. The new owners wanted a better forecast of their products to avoid the excessive spoilage the prior owners experienced. Avoiding having milk go past its sell-by date while not running out of Chunky Monkey both help the bottom line.
Each product category the convenience store offers has data from past sales: how much sold, when stockouts happened, seasonal sales trends and national demand. The savvy owners included local factors, such as local events (summer parade near them), local forecasted weather (heat waves), employment and cost of living. They also surveyed their customers to get their product preferences. They used the data to build a forecast that better stocked their shelves.
Best Practices for Inventory Forecasting
“The first key is to have as much data about your purchases, consumption and sales of items as possible,” Sloan said. “Six months of detailed transactions are the minimum, but without two years of seasonal trends, it’s difficult to get a good picture of your true monthly demand. Also, make sure you are getting accurate data from your suppliers and that you hold them accountable for that accuracy. Garbage in, garbage out will always be true.”
There are best practices you can use in every aspect of inventory forecasting, ranging from ensuring you’re using quality data to pulling in marketing team members. Here’s a useful list of best practices you can incorporate into your process:
- Build a team that collaborates in developing the forecast.
- Use an inventory management program that works well and provides documented processes.
- Keep a close eye on inventory turnover and whether you meet benchmarks. Learn more about inventory turnover with “Inventory Turnover Primer: Calculations, Rates and Analyses.”
- Use qualitative information to drive forecasting.
- Use all available historical supply and demand data.
- Calculate all past margins and profits and future goals, such as gross profit margin.
- Use the reorder point formula.
- Measure sales trends accurately.
- Use the lead time for demand.
- Calculate safety stock.
- Use software that supports your forecasting needs.
Another tip from Sloan: “Make sure that your demand planning engine is looking at where you fulfilled inventory from and also where you sent it. For example, if you shipped a bulky item from your Los Angeles warehouse to a customer in Florida, you want to make sure you stock that item next time in your North Carolina warehouse.”
Learn from past demand, and regularly implement new practices to support these lessons.
Tools for Inventory Forecasting
Supportive tools for inventory forecasting include basic spreadsheets and inventory management software systems. Basic spreadsheets are not dynamic but can work for companies with limited inventories.
Here are the main tools to help calculate demand:
- Spreadsheets: In businesses that have only a few products, basic spreadsheets can work. Use them to load in formulas and assumptions and perform basic calculations.
- Graphs: Simple graphs with time-series data can show future projections in a format that visually oriented people will appreciate.
- 3PL: Outsourcing logistics planning is certainly an option. Many logistics companies have statistical modelling experts on staff to meet the needs of growing businesses.
- Models: The point of forecasting is to build a model that is best for your business. In this way, you can load changes to the data and new scenarios into the model to see how stock quantities should change.
- Inventory Management Software: For companies that prefer an in-house solution that also tracks their inventory, some platforms also offer forecasting tools. For advice on selecting a solution, read our guide on choosing the right inventory management system for your business.
Automated Inventory Forecasting
Some software packages include automated inventory forecasting that takes advantage of machine learning to constantly improve the projection process. That way, instead of just tracking your inventory, you can forecast optimal stock levels, taking into account business goals and company processes.
Machine learning systems reduce errors in supply chain networks and decrease stockouts by training the algorithm to learn from the incoming data and make adjustments.
Streamline Your Inventory Forecasts with NetSuite
Striking a balance between having enough but not too much inventory can mean the difference between success and failure for a business. Developing an inventory forecast can help. Decision-makers know they need the right tools in place so they can manage and plan their inventory effectively. NetSuite offers a suite of native tools for tracking inventory in multiple locations, determining reorder points, managing safety stock and cycle counts and forecasting. Develop your company’s inventory forecast using NetSuite’s Demand Planning features.
NetSuite provides cloud inventory management solutions that are the perfect fit for a range of organisations, from small businesses to new startup companies to Fortune 100 companies.
Learn more about how you can use NetSuite to help manage and forecast inventory to reduce handling costs, increase cash flow and satisfy your customers.