
Supply chain leaders are constantly seeking an edge—they know that even a modest technical or process improvement, multiplied on the scale of modern supplier networks, can pay huge competitive and cost-saving dividends.
Often, though, where leaders run into problems is in quantifying the results of tweaks: Did that new track-and-trace solution pay off as expected? Are we fully capitalising on volume pricing? Should we condense shipments at the cost of a slight increase in average delivery times?
Our advice is to ask one more question: Are we collecting and analysing the right metrics to monitor the health of our supply chain and know whether investments are paying off?
In this article, we’ll outline 22 top supply chain metrics and KPIs, provide the formulas to calculate them, and discuss how dashboards can help track the success of your improvements and updates.
What Are Supply Chain Metrics?
Supply chain metrics are the numbers and ratios a company tracks to measure how efficiently it delivers goods to customers. Keys to efficiency in supply chain execution include how well and cost-effectively companies drive the flow of materials from procurement to delivery, including activities like production, warehousing and transportation.
The right metrics shed light on where to invest to achieve maximum returns.
Key Takeaways
- It’s vital to employ metrics and KPIs to assess how your supply chain is performing.
- Important KPIs for finance include cash-to-cash cycle times and gross margin return on investments.
- Inventory turnover ratios and inventory velocity are two central gauges of how well your company manages its intake and outflow of goods.
- A central KPI dashboard accessible to all stakeholders helps leaders stay on the same page and prioritise resources.
What are supply chain KPIs?
Supply chain key performance indicators (KPIs) quantify how well a supply chain is performing. Leaders need to decide which KPIs are most important to track.
Because there are many metrics that can add value, we often advise companies to divide supply chain KPIs into tiers based on functions. A company may decide on a bucket of top metrics that are most important to its business and watch some lower-tier KPIs occasionally.
Top Supply Chain Metrics
Below are 22 key metrics to measure supply chain performance and management. We’ve broken them into four sections: top-level management, inventory, shipping and more general metrics that apply to most industries.
Top-level supply chain management metrics and KPIs
Use these big-picture KPIs and metrics to measure whether your supply chain is running efficiently or needs a tune-up.
Cash-to-cash cycle time:
This metric tells you the length of time between when you pay suppliers for materials and when customers pay for the final finished product. You want the cycle time to be as short as possible.
Tracking this metric will help identify potential causes of cash flow issues. The most efficient companies have cash-to-cash cycle times of less than one month.
Use this formula to calculate cash-to-cash cycle time:
Cash-to-cash cycle time = receivable days + inventory days – payable days
Customer order cycle time:
Customer order cycle time tracks the number of days between your company receiving a purchase order and completing customer delivery. It helps measure the responsiveness of your supply chain and how well you’re providing customer service.
Use this formula to calculate customer order cycle time:
Customer order cycle time = actual delivery date – purchase order creation date
Supply chain cycle time:
Supply chain cycle time measures how long it would take to complete an order if inventory levels were zero. This KPI provides an overview of the efficiency of your entire supply chain.
Use this formula to calculate supply chain cycle time:
Supply chain cycle time = time it takes to order and receive supplies + order fulfilment cycle time
Service rate:
The service rate measures the percentage of product orders that are delivered on time.
Use this formula to calculate service rate:
Service rate = product orders delivered on time / product orders received
Perfect order index or perfect order delivery rate:
The perfect order index measures the percentage of your orders that are error-free from beginning to end. That means the order was recorded correctly, shipped on time and in the right quantities and arrived without damage.
Use this formula to calculate the perfect order index:
Perfect order = [(total orders – errors) / total orders] x 100
You also may want to track perfect orders with more details about where errors occur. That means you’ll want to track:
On-time delivery:
The percentage of orders that arrive as scheduled. Use this formula:
On-time delivery = [(total orders – orders that do not arrive on time) / total orders] x 100
In-full delivery:
The percentage of sales orders that are delivered completely in the first shipment. Use this formula:
In-full delivery = [(total orders – orders that aren’t complete or are incorrect in first shipment) / total orders] x 100
Damage-free delivery:
The percentage of orders that are delivered without any damages. Use this formula:
Damage-free delivery = [(total orders – orders that arrive damaged) / total orders] x 100
Accurately documented order:
Percentage of orders in which all documents relating to the order are accurate. Use this formula:
Accurately documented order = [(total orders – orders without accurate documentation) / total orders] x 100
Businesses can track their perfect order indexes by using the simple formulas above. But companies may also measure the index by multiplying their perfect order rates in various categories. For example, say you have a 92% rate of on-time delivery, a 95% rate for in-full delivery, a 97% rate in damage-free delivery and a 98% rate in accurately documented delivery.
Looks good, right? Take a moment to calculate your perfect order rate by multiplying each percentage, or 0.92 X 0.95 X 0.97 X 0.98. That would yield a less-than-stellar unified perfect order delivery rate of 83%.
Gross margin return on investment (GMROI):
The gross margin return on investment measures how much money a company makes on a specific inventory investment. Tracking this metric gives your company insight into which inventory items are especially poor or especially good performers. In general, a GMROI of 200 to 225 is considered respectable.
Use this formula to calculate gross margin return on investment:
Gross margin return on investment = gross profit / [(opening inventory in the period – closing inventory in the period) / 2] x 100
Total supply chain management cost as percentage of sales:
Total supply chain management cost as percentage of sales is fairly self-descriptive. It measures the total cost of your supply chain operations compared with your overall sales.
Use this formula to calculate total supply chain management cost as percentage of sales:
Total supply chain management cost as percentage of sales = (total supply chain costs / total sales) x 100
Supply chain cost per unit sold: Supply chain cost per unit sold measures your supply chain costs compared with how many of a given item your company sells.
Use this formula to calculate supply chain cost per unit sold:
Supply chain cost per unit sold = supply chain costs for a product over period / number of units sold in that period
Day sales outstanding: Day sales outstanding measures how quickly you collect revenue from your customers. A low day sales outstanding number means you are generating revenue more quickly, which ultimately improves your cash flow.
Use this formula to calculate day sales outstanding:
Day sales outstanding = (receivables / sales) x number of days in a period
#1 Cloud ERP
Software
Inventory metrics and KPIs
Use these metrics and KPIs to measure how well your inventory operations are performing. It’s worth periodically running an inventory analysis exercise to help find ways to fill customer orders while keeping costs as low as possible.
Inventory days of supply (IDS):
IDS represents the number of days it would take a company to run out of inventory if it didn’t add to its supply.
It’s important to track this number to ensure your company doesn’t keep too much inventory on hand, which ties up cash, but that it has enough to satisfy customer demand. That sweet spot is sometimes called the par level.
Inventory days of supply helps your company understand and maintain its par level. Use this formula to calculate IDS:
Inventory days of supply = (average inventory in a month, in dollars / monthly product demand, in dollars) x 30
Days sales of inventory (DSI):
Days sales of inventory calculates the average number of days that inventory remained in stock over a certain period. It’s a measurement of how long it takes a business to sell the items it makes or buys.
Use this formula to calculate days sales of inventory:
Days sales of inventory = (ending inventory / cost of goods sold) x number of days in period
Inventory-to-sales ratio (ISR):
The inventory-to-sales ratio compares the inventory you carry to your overall sales. It’s a measurement of the financial stability of your company. The ratio is closely related to your inventory turnover ratio.
Use this formula to calculate inventory-to-sales ratio:
Inventory-to-sales ratio = inventory value in dollars / sales value in dollars
Inventory turnover ratio (ITR):
The inventory turnover ratio measures how often a company’s entire inventory is sold in a specific period. What comprises a “good” inventory turnover ratio depends on the industry. But in general, a lower inventory turnover ratio means a company may have excess inventory due to lagging sales.
Use this formula to calculate inventory turnover ratio:
Inventory turnover ratio = cost of goods sold in period / [(opening stock in period – closing stock in period)/2]
Turn-earn index (TEI):
The turn-earn index combines inventory turnover and gross margin to evaluate your company’s profits and use of inventory. In essence, the index recognises that your company can get by with less inventory turnover if it makes a lot of money on that inventory. But it needs more inventory turnover if it realises a lower margin on the inventory.
Generally, most businesses will want a turn-earn index of at least 150. Use this formula to calculate the turn-earn index:
Turn-earn index = (inventory turnover ratio x gross profit percentage) x 100
Inventory velocity (IV):
Inventory velocity is the portion of inventory that your company projects it will exhaust within the next specified period. The metric helps your company set optimum inventory levels so that you don’t carry too much inventory but retain enough to satisfy projected sales in the coming period.
An inventory velocity of 60% to 70% is a solid benchmark, with up to 80% for fast-moving inventory items. An IV above 80% is high and could lead to excess inventory, while inventory velocity below 60% is low and could presage shortages.
Use this formula to calculate inventory velocity:
Inventory velocity = opening stock / upcoming period’s sales forecast
Months on hand:
Months on hand indicates how many months of inventory you have at your disposal if you purchase no more stock while your sales continue as forecast.
Use this formula to calculate months on hand:
Months on hand = (average inventory for year / cost of goods sold for year) x 12
Stock rotations:
Stock rotations, also called stock life or stock coverage, refers to the number of days, on average, that it takes for you to run out of your inventory stock. It is best to use the past 52 weeks to figure this calculation. That allows for enough time to show seasonal and other variations. If you have a low stock rotations number, you risk running out of stock and failing to meet customer demand.
Use this formula to calculate stock rotations:
Stock rotations = (average stock in a period / total sales in a period) x number of days in the period
Supply chain shipping metrics and KPIs
Logistics managers may use these KPIs and metrics to determine if there are weaknesses in the network of businesses and organisations working in a sequence of processes to produce and distribute goods. As with inventory, it’s worth periodically taking stock of the logistics links in your supply chain.
Fill rate:
Fill rate is the percentage of customers’ orders that are filled on their first shipments—an important contributor to customer satisfaction. It’s also a measure of your company’s efficiency.
Use this formula to calculate fill rate:
Fill rate = (1 – [(total items – shipped items) / total items]) x 100
You can also track specific aspects of fill rate, including:
- Order fill rate: The percentage of orders delivered on the first attempt.
- Line fill rate: The percentage of order lines delivered on the first attempt.
- Unit fill rate: The percentage of individual items delivered on the first attempt.
Calculate all three by substituting them into the fill rate formula.
Freight bill accuracy:
Freight bill accuracy measures the precision of your orders and shipping bills. Shipping the wrong items or the wrong amounts is wasteful and lowers customer satisfaction.
Use this formula to calculate freight bill accuracy:
Freight bill accuracy = (number of correct freight bills / total freight bills) x 100
Freight cost per unit:
Freight cost per unit measures how economically you ship your products. It measures your total freight costs divided by how many units you’ve shipped. You can calculate units in pounds, items or any other measurement that makes sense.
Use this formula to calculate freight cost per unit:
Freight cost per unit = total freight cost / number of units
On-time shipping rate:
The on-time shipping rate is the percentage of times your customer receives product within the promised shipping window. Tracking this metric helps assess the efficiency of your supply chain processes. It can also help you pinpoint the proper “on-time delivery” benchmarks for various products.
Use this formula to calculate on-time shipping rates:
On-time shipping rate = (number of items delivered on time in a period / total items shipped in the period) x 100
Other supply chain metrics and KPIs
These are a few other metrics and KPIs that can affect the supply chain.
Average payment period for production materials:
The average payment period for production materials is the average timespan between when you receive materials and when you pay for them. By tracking this metric you can favor suppliers that offer more favorable billing terms and thus improve your cash flow.
Use this formula to calculate average payment period for production materials:
Average payment period for production materials = (materials payables / total cost of materials) x days in period
Supplier on-time delivery:
Supplier on-time delivery measures the percentage of time your suppliers deliver products to you in the agreed-on timeframe.
Use this formula to calculate supplier on-time delivery:
Supplier on-time delivery = (number of products supplier delivers on time in a period / total items supplier ships in the period) x 100
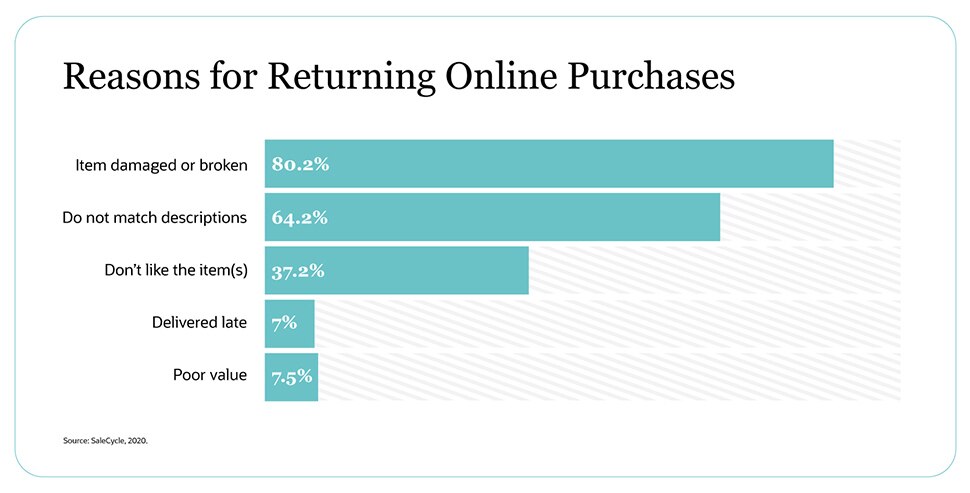
Return reason:
The return reason measurement shows the top issues that cause customers to send items back. This can help you assess weaknesses in your product lines or operations and is important to track given the high cost of reverse logistics operations.
The return reason measurement will quantify, in percentages, the top reasons customers send goods back and display them in a chart that’s easily consumable by supply chain and business unit leaders, who can then take action to fix problems.
Order to cash:
While order to cash covers some processes outside of the supply chain, the performance of the supply chain is an important component. Order to cash is a measure of the company’s entire system to receive, process and complete orders. It covers the time from when a customer places an order to when the company receives and records the customer’s payment.
What constitutes a good order-to-cash ratio depends on the industry, and this metric takes into account the efficiency of your order management, logistics and accounts receivable functions.
Use this formula to calculate customer order to cash:
Order to cash = date of customer order – date of receipt and recording of customer payment for order, after receiving order
Bottom Line
Clearly, there’s no shortage of KPIs and metrics that can provide supply chain and business leaders with invaluable insights into their operations. Companies with automated data collection, a central database and a customisable dashboard will have an edge in spotting areas to squeeze out costs and add efficiencies.
Supply chain managers should work with their finance and line-of-business colleagues to identify the right KPIs while at the same time advocating for investments. Building more resilient digital supply chains, for example, can reduce costs by as much as 20%, boost EBITDA, increase revenue by as much as 6% and improve customer service by as much as 30%.
Supply Chain KPI and Metrics FAQs
How can you use KPIs in supply chain analytics?
Data analysis tools are the key to making KPIs actionable. With the right metrics and predictive analytics, companies can increase forecast accuracy, keep inventory levels optimised, improve logistics and shipping operations, maximise cash flow, and minimise customer returns.
The goal of supply chain analytics is to find and fix inefficiencies in the supply chain, from raw materials to finished goods and all points in between.
How do you measure the performance of a supply chain?
Ask: What’s our company’s differentiator? If you’re known for fast and accurate order fulfilment, track fill rate, freight bill accuracy and on-time shipping rate. If you’re a retailer of fast fashion, then inventory to sales ratio (ISR), inventory turnover ratio (ITR) and your turn-earn index will be key.
In most companies, the finance team will want insights into cash-to-cash cycle time, average payment period for production materials and gross margin return on investment (GMROI).
What are the drivers of supply chain performance?
Your company’s supply chain starts with accepting an order and ends with the customer receiving and paying for finished goods. In that light, the drivers of your supply chain’s performance are production, warehousing, inventory management, shipping and forecasting—including predicting future sales of your products.
You can also assess some aspects of supply chain performance through a supply chain visibility project.
How can you leverage supply chain management to improve your bottom line?
In many industries, margins are tight, and competition is fierce. Driving inefficiencies out of your supply chain is a way to improve the bottom line while, in many cases improving the customers experience.
Areas where money is often wasted include having multiple small or incomplete shipments going to the same location or keeping too much inventory on hand rather than taking a “just in time” approach, where raw materials arrive—and are paid for—just as production is scheduled to begin.