In short:
- Measuring returns is critical in evaluating potential investments, gauging the success of existing projects and monitoring business performance as a whole. However, it can be hard to identify the right calculations for your needs.
- Both total investment returns and going concern returns can provide valuable information for your company.
- We break down the formulas for ROI, NPV, IRR, ROE, ROA, ROIC and ROCE — including how to use them effectively, examples, and their respective strengths and limitations.
ROI, ROE, ROIC … the list goes on. All you want to do is measure your business’s returns, but instead, you’re drowning in acronyms.
Measuring returns in business is a critical task to ensure the viability and effectiveness of a project, investment or even the business as a whole. In a recovering economy, using available calculations to monitor operational performance becomes even more critical. Yet, knowing which measures to use — and their associated best practices — can quickly become information overload.
Fear not: We have compiled the top measures for predicting and gauging returns, whether you’re analysing a particular project or the business as a whole. We’ll walk through each formula so you can stop floundering in calculation confusion — and start using a metrics-driven approach to business.
Return Calculations Overview
Before we jump into the formula fun, note that calculations to gauge returns are often split into two categories based on their scope: Those that address total investment returns and those that handle going concern returns.
| Total Investment Returns | Going Concern Returns |
|---|---|
| These return calculations measure standalone, one-off projects and investments. They’re used to both predict the success of potential investments and gauge the performance of existing ventures. | Rooted in the “going concern” accounting concept, these returns monitor the operational performance of the entire businesses. |
| These internal-facing return measures include: ROI, NPV, IRR. | These “big picture,” external return measures include: ROE, ROA, ROIC, ROCE. |
While each measure has its own purpose, none should be viewed in isolation. Collectively, metrics from each category can provide insight into the entire operational performance of a business on a small and large scale.
We’ll dive into calculations for each measure below, as well as what each is used for (e.g., gauging success of a project vs. the business as a whole), and by whom (e.g., by investors vs. company managers). Before we do, here’s a snapshot of everything we’ll cover, for you to paste on your fridge (or simply reference as you read onward).
Return Calculations
| Type | Category | Formula | Purpose | Common Use |
|---|---|---|---|---|
| ROI | Total Investment Returns | (Net Profit / Cost of Investment) x 100 | Determines gain or loss of an investment as a percentage of the cost | Internally, for individual projects or investments |
| Annualised ROI | Total Investment Returns | [(1+ROI)1/n −1]×100% | Same as ROI, but with the time factor included | Externally, by investors evaluating stocks |
| Net Present Value (NPV) | Total Investment Returns | (Today’s Value of Expected Cash Flows) - (Today’s Value of Invested Cash) | Calculates today’s value of expected future cash flows | Internally, for individual projects or investments |
| Internal Rate of Return (IRR) | Total Investment Returns | See “How do you calculate IRR?” below. | Determines the percentage rate of return at which the cash flow of a project will break even | Internally, for individual projects or investments |
| Return on Equity (ROE) | Going Concern Returns | Net income / Shareholder equity | Measures the profitability of a corporation in relation to its total amount of shareholder equity | Externally, by investors to understand how much money they’re getting back from an investment and how that compares to other companies in the industry |
| Return on Assets (ROA) | Going Concern Returns | Net Income / Average Total Assets | Determines how profitable a company is relative to its assets | Internally, by managers to measure efficiency, particularly in industrial & manufacturing industries |
| Return on Capital Invested (ROIC) | Going Concern Returns | NOPAT* / Invested Capital | Measures the percentage return that a company earns on invested capital | Externally, by investors to evaluate what they’re likely to get as dividends, since it is based on after-tax figures |
| Return on Capital Employed (ROCE) | Going Concern Returns | EBIT / Capital Employed | Determines how well a company is generating profits from its capital employed | Internally by the company, since it is based on pre-tax figures and can be used to assess the ability of managers to efficiently use capital |
*NOPAT = Net operating profit after tax
Total Investment Return Formulas
ROI
What is ROI?
Let’s start with the bread and butter of gauging returns: return on investment (ROI). ROI tends to be the simplest and most common profitability calculation used to determine the efficiency of investments. The ratio looks at the gain or loss of an investment as a percentage of the cost.
How do you calculate ROI?
While the term is often tossed around colloquially to describe both qualitative and quantitative benefits of an investment, there is actually an official formula for ROI:
|
ROI = (Net Profit / Cost of Investment) x 100 |
It can also be thought of as:
|
ROI = [(Final Value of Investment - Cost of Investment) / Cost of Investment x 100%] |
A positive ROI indicates that the investment is good. The higher the number, the better.
Strengths and weaknesses of ROI
Many of the ROI calculation’s benefits lie in its simplicity. The basic formula is well-known, standardised, easy to calculate and well-understood, even amongst non-finance professionals.
However, its simplicity is also its weakness. ROI does not account for investment risk nor the time value of money, which is a major factor in determining the value of an investment. You can mitigate the time issue by using a variation of the ROI formula, called annualised ROI:
|
Annualised ROI = [(1+ROI)1/n −1] × 100% In this equation, n is equal to the number of years for which the investment is held. |
While annualised ROI tends to be more of an investors’ calculation, it can play a role in your business. Just note that it tends to look at an investment over either a very long time or in perpetuity.
For example, let's say your company could open a store in location X at some cost, or in location Y at a different cost. The annualised ROI equation can help estimate sales revenue in each location, then determine which will make more money in the long run — or get the initial investment back the fastest.
ROI example
An ecommerce store invests in a $20,000 robot to build out its manufacturing capabilities. Within the first two years of implementation, the robot has earned the company $30,000 by increasing the number of products the company can create. So, the calculation would be as follows:
|
$30,000 - $20,000 = $10,000 (Net Profit) |
Now, the quality of an ROI percentage can be somewhat subjective based on what the company is looking for — however, a 50% ROI is almost inarguably good considering anything above 12% tends to be considered excellent.
NPV
What is NPV?
Net present value (NPV) is a popular tool to gauge a potential investment because it takes the time value of money into account. It calculates the value of projected cash flows, discounted to the present. Because money is worth more today than in the future — due to inflation and earnings from an alternative investment you could make instead — it’s important to understand the impact of time on a potential investment.
Simply put, NPV calculates the ROI you expect to gain and translates it into today’s dollars to answer the question: Is the stream of future cash flows worth more than our present investment? It addresses the speed of return and factors in risk, two things typical ROI calculations don’t do.
How do you calculate NPV?
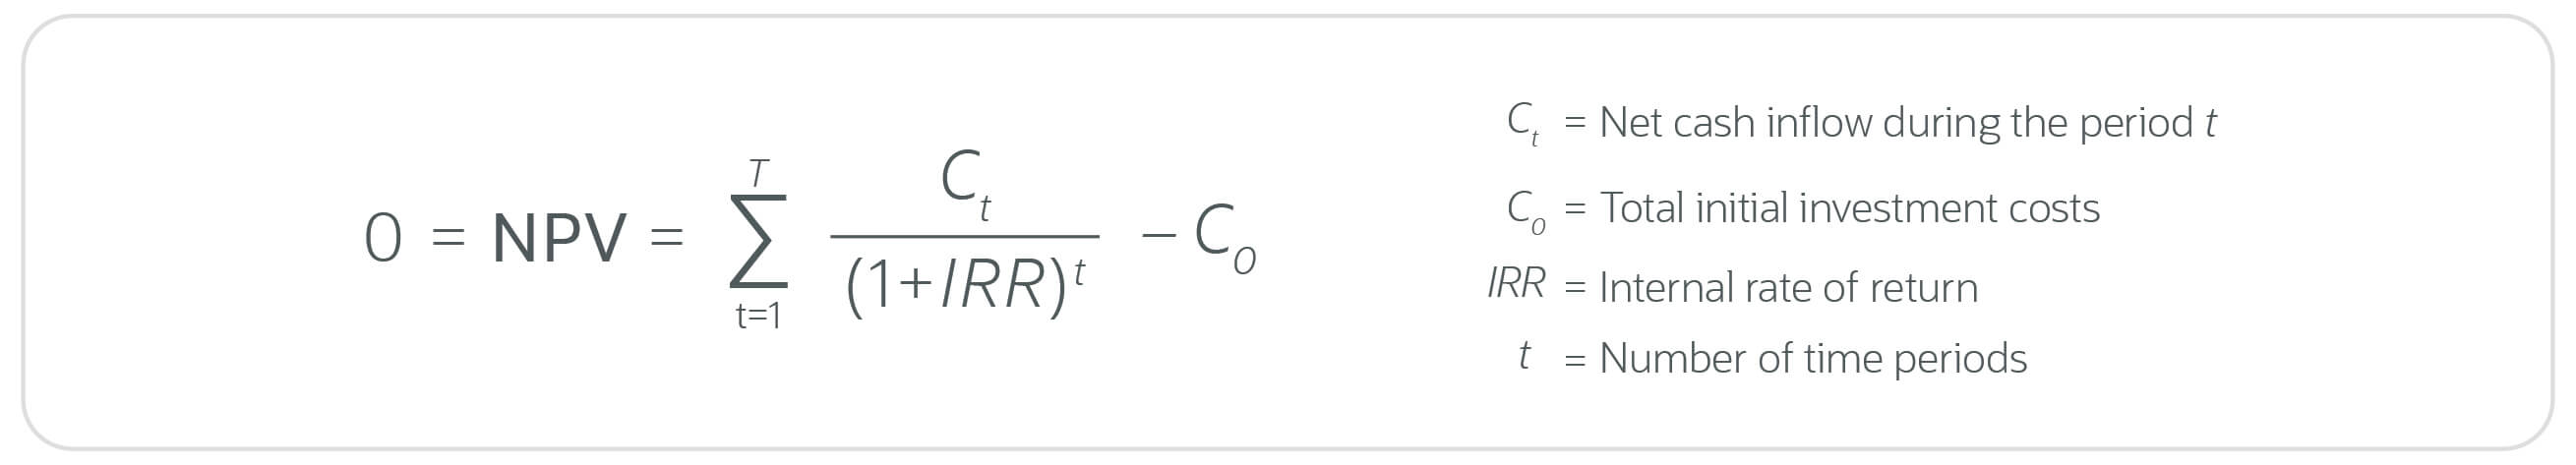
The formula to calculate NPV is:

If you’re a bit rusty on summation notation, NPV can also be thought of as:
|
NPV = TVECF − TVIC TVECF: Today’s value of the expected cash flows |
The aforementioned discount rate adjusts for the risk of an investment opportunity and accounts for the time value of money, discounting future cash flows back to their present value. Typically, the bigger the risk, the higher the discount rate.
This is the challenge of NPV. It’s the best way to compare competing investments — but only if you can perfectly estimate risk. Imagine you’re a widget maker and a company like Boeing offers you a 10-year contract to make a new kind of widget. Great! You have no risk as long as you can perform, so the discount rate is the 10-year Treasury bill rate.
On the other hand, let’s say you own a chain of coffeeshops in a given city. You decide it’s time to open shops in a new city. You have a good track record of predicting revenue in your existing shops, but there’s that unknown of bringing your brand to a city that doesn’t know it. Estimating that risk is challenging. You can look at the competition and the socioeconomic makeup of the target city, but there’s also the matter of marketing your brand in a new place. Getting that discount rate right is tricky and comes down to hard-to-measure things like marketing efficacy and brand value.
There are several types of discount rates that tend to play a role in calculating returns. And each involves a different view of risk:
Discount Rates
| Type | Description | Formula |
|---|---|---|
| Weighted Average Cost of Capital (WACC) | A company’s cost of capital across all sources | [Cost of Equity x % of Equity] + [Cost of Debt x % of Debt x (1 - tax rate)] |
| Cost of Equity | The rate of return a company pays out to equity investors | (Dividends Per Share / Current Market Value of Stock) + Growth Rate of Dividends |
| Cost of Debt | The effective interest rate a company pays on its debts | Interest Rate x (1 - Tax Rate) |
| Predefined Hurdle Rate | Lowest rate of return the project must earn in order to offset the costs of the investment | WACC + Risk Premium |
| Risk-Free Rate | The minimum rate of return on an investment with theoretically no risk | [(1 + Government Bond Rate) / (1 + Inflation Rate)] - 1 |
A discount rate is expected to reflect a risk-adjusted rate of return, which a WACC can approximate if you’ve borrowed or sold equity to fund past projects.
You can calculate NPV through a function in Excel and online calculators. Determining a “good” NPV is relatively straightforward, as long as you trust your determination of risk. A positive NPV dollar amount indicates a worthwhile investment to consider. A negative number means the investment is not advantageous. The higher the number, the better the investment. And thus you can compare competing projects: the higher NPV wins. In theory, an NPV is “good” if it is greater than zero. Therefore, even an NPV of $1 should theoretically qualify as “good”. In practice though, many companies will incorporate their own NPV thresholds to ensure it’s worth the effort and risk.
Strengths and weaknesses of NPV
Aside from recognising the time value of money, NPV is considered useful because you can use it to easily compare investment options of the same size, which fuels smarter, more strategic decision-making.
However, it has its shortcomings. For instance, NPV provides an absolute figure, not a percentage, so it can’t be used to compare projects of different sizes. It also assumes the discount rate remains the same — but discount rates can and do change over time as project revenue guesses become facts.
NPV example
Let’s say that same ecommerce company from our ROI example now wants to incorporate the time factor into its robot’s decision-making. The discount rate, in this case using the company’s WACC, is determined to be 10%. Cash flow from the investment is anticipated to be $15,000 each year. The time period being examined is the next five years — after that, the bot will likely need to be replaced. Our calculations would be as follows:
| Year | 0 | 1 | 2 | 3 | 4 | 5 |
|---|---|---|---|---|---|---|
| Discount Factor | 10% | 10% | 10% | 10% | 10% | |
| Undiscounted Cash Flow | -20,000 | 15,000 | 15,000 | 15,000 | 15,000 | 15,000 |
| Computation | -20,000 / (1+ 0.1)0 | 15,000 / (1 + 0.1)1 | 15,000 / (1 + 0.1)2 | 15,000 / (1 + 0.1)3 | 15,000 / (1 + 0.1)4 | 15,000 / (1 + 0.1)5 |
| Present Value | -20,000 | 13,636.36 | 12,396.69 | 11,269.72 | 10,245.20 | 9,313.92 |
Thus, the NPV equals $36,861.89, which is considered a “good” number because it’s positive.
#1 Cloud
Accounting
Software
IRR
What is IRR?
Internal rate of return (IRR) is used in conjunction with NPV, though it involves different variables. It calculates the percentage rate of return at which those expected cash flows — which we considered with NPV — will result in a net present value of zero. Unlike NPV, which looks for the dollar amounts a given project will earn, IRR focuses on the breakeven cash flow of a project. The faster you get to breakeven, the better the project is for the company.
How do you calculate IRR?
One part of that equation may be bugging you: If we are solving for IRR, why is IRR included in the formula? IRR is calculated through “trial and error,” so to speak. You’ll use online calculators, Excel or software to plug numbers into the IRR spot until the NPV is equal to zero.
The higher the IRR, the better. Or the higher the IRR on a project, and the greater the amount by which it exceeds the cost of capital, the higher the net cash flows to the company.
Strengths and weaknesses of IRR
Despite the complex-looking equation, IRR is considered one of the simpler ways to determine whether a project is economically viable. It does not require that a company identify the hurdle rate or required rate of return prior to performing the calculation — though you will need to know the cost of capital to gauge whether the IRR is “good.” Instead, the rate of return is simply derived from the underlying cash flow. IRR’s value also lies in its ability to simply illustrate the risk associated with the investment: Fall below the required return rate, and the project should be rejected; come in above, and it should be considered.
Also like NPV, the IRR method does not account for project size when comparing projects. It also doesn’t necessarily account for the reality of reinvestment. The calculation assumes that future cash flows can be reinvested at the same rate as the internal rate of return when, in reality, the number generated by the IRR can be quite high — and a tad unrealistic. Especially when you’re doing high-IRR projects, there aren’t many other projects available in the interim that can earn the same rate of return.
There is also the “multiple IRR” risk. If a project has a nonconventional cash flow pattern (i.e. when at least one future cash inflow is followed by cash outflow), it can result in more than one IRR result.
For those reasons, IRR tends to be considered a good way to get additional information on a project — but not useful as the sole determinant.
IRR example
Using the same scenario and numbers as before, let’s find the IRR of the ecommerce company’s manufacturing investment:
| Year | 0 | 1 | 2 | 3 | 4 | 5 |
|---|---|---|---|---|---|---|
| Undiscounted Cash Flow | -20,000 | 15,000 | 15,000 | 15,000 | 15,000 | 15,000 |
| Computation | -20,000 / (1 + IRR)0 | 15,000 / (1 + IRR)1 | 15,000 / (1 + IRR)2 | 15,000 / (1 + IRR)3 | 15,000 / (1 + IRR)4 | 15,000 / (1 + IRR)5 |
| Equation | 0 = -20,000 / (1 + IRR)0 + 15,000 / (1 + IRR)1 + 15,000 / (1 + IRR)2 + 15,000 / (1 + IRR)3 + 15,000 / (1 + IRR)4 + 15,000 / (1 + IRR)5 | |||||
Here is where we start pluggin’ and chuggin’. Manually handling the equation requires that we guess the IRR and build from there. Let’s try 50%:
| Equation | 0 = -20,000 / (1 + 0.5)0 + 15,000 / (1 + 0.5)1 + 15,000 / (1 + 0.5)2 + 15,000 / (1 + 0.5)3 + 15,000 / (1 + 0.5)4 + 15,000 / (1 + 0.5)5 |
We end up with 6,049.38. Close, but not quite. We need to up the IRR a bit.
… I’ll save you from reading through unsuccessful estimates. Ultimately, after trying a few more numbers, our estimates will bring us to an IRR of 69.666%. Our IRR of about 70% suggests that the proposed investment will generate an average annual rate of return equal to 70% over the life of the project taking into consideration the amount and timing of the expected cash inflows and outflows specific to that investment. Considering this is significantly higher than the WACC for our hypothetical ecommerce business (10%), this is a good IRR.
Going Concern Returns Formulas
Remember that second category of return calculations? Here we go:
ROE
What is ROE?
Return on equity (ROE) measures the profitability of a corporation in relation to its total amount of shareholder equity. Essentially, the ratio gauges how good the company is at generating returns on the investment it received from its shareholders.
How do you calculate ROE?
ROE is found using the following formula:
|
ROE = Net Income / Shareholder’s Equity |
“Shareholder’s equity” should be a company’s assets minus its debt.
If your company issues cash dividends, note these will impact the net shareholder equity and therefore influence the ROE figure. When a company pays cash dividends, its shareholders’ equity is decreased by the total value of all dividends paid. A reduction in shareholder equity translates to a smaller denominator in the equation — which means a boosted ROE. However, note that stock dividends do not affect the shareholders’ equity.
When considering ROE, a general shortcut is that anything less than 10% — including negative percentages — is considered poor. Over 15% is a good ROE. A high ROE indicates that a company is proficient at turning equity investments into profits.
However, note that what constitutes a satisfactory ROE is highly dependant on the industry norm and your company’s peers. Industries like telecom and utilities typically have a low ROE (likely due to their high debt levels), whereas hospitals and healthcare facilities tend to have very high ROE. So a ROE that may seem “good” or “bad” initially could, in fact, be average for the industry.
Strengths and weaknesses of ROE
ROE is considered an effective way to assess a company’s financial returns and efficiency. It provides a snapshot of how effective management is at using investor capital and producing value. Additionally, you can easily use the metric to compare performance against competitors.
However, ROE can be misleading for several reasons. For instance, by carrying high debt levels and repurchasing shares, management can increase a company's financial leverage and thus its ROE, but too much of either can produce an unreasonably high ROE that doesn't accurately represent the company's profitability.
ROE also fails to account for a company’s future potential. A startup will likely have zero or negative net income, even though it has significant shareholder investment. This will result in an ROE of zero, or even a negative.
A company’s accounting practices can manipulate ROE, both intentionally and not. Various accounting caveats like increasing the project life and decreasing depreciation rate, for instance, can render comparison against competitors using ROE a potentially useless exercise.
Lastly, determining shareholder equity isn’t exactly a walk in the park. You need to first determine the company’s assets — and accounting for a full roster of assets can be deceptively difficult. Tangible assets (i.e. physical resources like cash, stocks, bonds and property), are relatively easy to gauge. However, you also have intangible assets, like your brand, copyrights, patents, trademarks, goodwill and IP. These values tend to be nebulous — which makes it hard to determine them for use in the ROE formula.
ROE example
Our ecommerce company has an annual net income of $1,000,000. Its shareholders’ equity is $5,000,000.
Net Income ($1,000,000) / Shareholder Equity ($5,000,000) = 20% ROE
Though it depends on the industry standard and the company’s peers at the time, this would generally be considered a strong ROE.
The DuPont method
When looking into ROE, you’ll likely come across the DuPont method, also referred to as the DuPont identity, equation, analysis or model. This is an ROE metric, just expanded. It breaks apart the components of ROE to determine what drives changes in ROE, or why an ROE is considered high or low — helping to negate some of the aforementioned issues with its leverage sensitivity. The method is:
|
ROE Formula = Profit Margin x Total Asset Turnover x Leverage Factor |
For companies wary of misinterpreting the ROE metric, the DuPont Method can help deduce whether it’s profitability, use of assets or debt that’s driving ROE.
ROA
What is ROA?
Return on assets, or ROA, is a profitability ratio that determines a company’s profitability relative to its assets. The percentage it provides illustrates how much profit a company generated for each dollar of assets invested in the business. It is particularly helpful for internal use by managers to measure efficiency, particularly in asset-heavy sectors like manufacturing.
How do you calculate ROA?
Calculate ROA by dividing a company’s net income over its total assets:

Total assets include all assets the company owns that have current or future economic value (e.g. cash, cash equivalents, accounts receivables, inventory, fixed assets, marketable securities, intangible assets and more).
A higher ROA indicates more asset efficiency. A ROA of around 15% would be considered healthy, and 20% or higher would be good. However, this may vary by industry: For instance, the Federal Reserve of Saint Louis tracks the ROA of banks, where the average tends to hover at 1%. Yet, in an industry like technology, ROA averages are between 10-20%.
Strengths and weaknesses of ROA
ROA is a valuable tool when it comes to comparing the performance of one company to another. Because it calculates a percentage, it can be used to evaluate companies with different sizes of assets.
The limitations of ROA are similar to those of ROE, primarily lying in the ambiguity of accounting methods. Whether purposeful or not, management’s judgements around accounting methods can impact a company’s ROA.
And again, note the difficulty of determining a company’s total assets. Don’t believe intangibles have a big impact? Tell that to Apple. Its brand alone is worth $260.2 billion.
ROA example
Above, we designated the net income of our ecommerce company as $1,000,000. Its total assets are calculated to be $7,000,000.
$1,000,000 (Net Income) / $7,000,000 (Total Assets) = 14.29% ROA
Again, the viability of this metric will vary by industry, but this is generally considered within a healthy range.
ROIC
What is ROIC?
Return on invested capital, or ROIC, aims to measure the percentage return that a company earns on invested capital. The ratio gives a sense of how well a company is using its money to generate returns. Boiling it even further down, it's measuring how efficient a company is in generating cash flow from the areas in which it has invested its capital.
How do you calculate ROIC?
The formula for ROIC is:
|
ROIC = Net Operating Profit After Tax (NOPAT) / Invested Capital |
A ROIC greater than the cost of capital means the return of a company's projects exceeded the cost to fund those projects, meaning the company is creating value. On the other hand, if the ROIC is lower than the weighted average cost of capital, the business is losing value.
Generally speaking, a company is considered to be a value creator if its ROIC is at least 2% more than the cost of capital; a value destroyer is typically any company whose ROIC is 2% less than its cost of capital.
Strengths and Weaknesses of ROIC
ROIC takes into account the overall return on both equity and debt. This means the impact of capital structure on profitability is essentially nullified — allowing us to compare companies with different capital structures in a similar industry. It also analyses the performance of all invested capital, a trait notably missing from other performance measures. It is also considered one of the simpler metrics of which to determine “success” since you simply need to compare it to the company’s cost of capital.
While ROIC is very useful, you should only use it to compare companies in the same or similar industries. Note ROIC is susceptible to significant one-time expenses (e.g., an organisation-wide restructuring) or revenues (e.g., an extraordinary benefit from a currency fluctuation).
ROIC example
Our hypothetical ecommerce company has an EBIT of $1,750,000 and a tax rate of 30%. Using the NOPAT calculation (EBIT x (1 - Tax Rate), we come up with a NOPAT of $1,225,000. The company has $8,000,000 in invested capital. Thus:
1,225,000 (NOPAT) / 8,000,000 (Invested Capital) = 15.3% ROIC
Since our previously-determined WACC of 10% exceeds our cost of capital by more than 2%, this company is considered a “value creator.”
ROIC: so hot right now
It has taken a curiously long time for the ROIC metric to gain traction. Nobel prizewinners Franco Modigliani and Merton Miller identified ROIC as a major component of value creation and destruction. And over 30 years ago, Warren Buffet asserted that company heads aren't skilled enough in capital allocation. In 2007, he wrote to shareholders that “a truly great business must have an enduring ‘moat’ that protects excellent returns on invested capital.”
Emphasis on ROIC has risen in the past decade. In 2015, General Motors placated activist investors by tying compensation to a 20% target. GM said that beyond a $20 billion cushion, cash upon which it couldn’t earn that return would be handed back to shareholders, leading the Wall Street Journal to tout ROIC as the "hottest metric in finance.” Jamie Dimon, in his 2018 letter to shareholders of JPMorgan Chase, cited ROIC as a key measure of value.
A good ROIC metric means sustainable value creation that is easier to maintain at a high level than something like growth. For many, ROIC is a much better alternative performance metric, as it measures the return on all invested capital, including debt-financed capital. Though metrics like ROE are historically better-known and more frequently used, ROIC looks to be the “metric of the future.”
ROCE
What is ROCE?
Return on capital employed, or ROCE, looks to determine how well a company is generating profits from its capital.
That might sound deceptively similar to ROIC. However, ROCE looks at capital employed in relation to net operating profit, whereas ROIC looks at invested capital in regards to net operating profit:
| Invested Capital | Capital Employed |
|---|---|
|
|
How do you calculate ROCE?
Use the following formula:
|
ROCE = Earning Before Interest and Tax (EBIT) / Capital Employed Calculate “capital employed” by subtracting current liabilities from total assets. |
Like for ROE, the criteria for an optimal ROCE tend to depend on industry and sector, and attempts to compare between industries likely won’t offer much insight. And again, the higher the percentage, the better. The key to a great ROCE is consistency. One good year doesn’t mean much. Aim for several years of strong ROCE performance to prove sustainability.
Strengths and weaknesses of ROCE
ROCE tends to be a good performance metric to consider when evaluating capital-intensive industries, like telecom and utilities, since it looks specifically at capital invested. Like ROIC, it captures the monetary return on both equity and debt, making it a good fit for comparing companies on that plane, even if they have differing capital structures.
For non-capital-intensive industries, ROCE may present a skewed perspective. It counts large cash reserves as part of the capital employed, even though these reserves may not yet be employed. As such, this inclusion of the cash reserves can actually overstate capital and reduce ROCE.
ROCE example
As previously mentioned, our ecommerce company’s EBIT is $1,775,000. Let’s say our capital employed is $10,000,000. Using our equation:
1,775,000 (EBIT) / 10,000,000 (Capital Employed) = 17.75% ROCE
While highly dependant on industry norms, the long-term average for ROCE across industries and sectors is around 10%, rendering this ROCE higher than the average. Note that an excellent ROCE is above 20%.