SuiteScript Debugger is the first real-time, web based interactive debugger to allow code validation and testing as third-party applications run on the application server. Unlike SAAS development environments that support testing of third-party applications on client machines, SuiteScript Debugger enables third-party applications to be tested in an actual server environment against live data, allowing developers to see and correct the behaviour exhibited by the application in real-world conditions.
SuiteScript Debugger is a Web-based debugging tool that uses a familiar metaphor and interface reminiscent of debuggers found in popular Integrated Developer Environments (IDE) such as Microsoft Visual Studio. It allows developers to step through their code in real-time. And it provides a debugging tool set with controlled code execution such as step in, out, and over as well as execution logs, resolution of local variables, watches and break points.
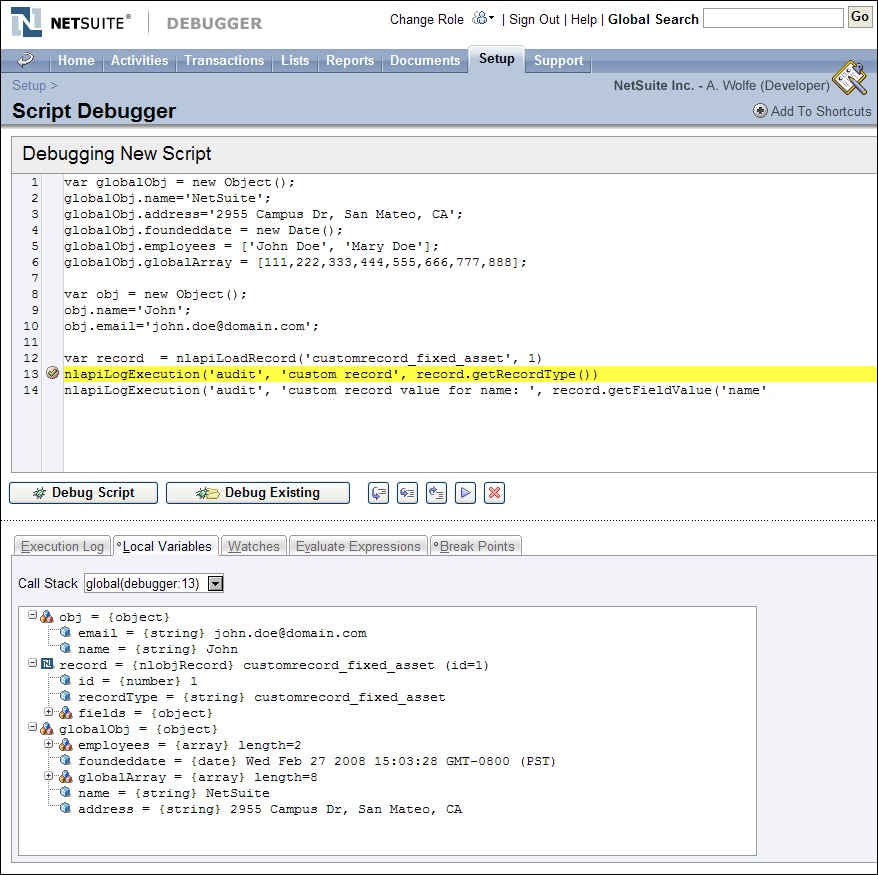
SuiteScript Debugger : Two Modes of Interaction
You can examine your newly created application and its interaction with the NS-BOS platform. SuiteScript Debugger offers two modes of interaction, one for ad-hoc code fragments and the other for debugging User Event, Scheduled, Portlet, or Suitelet scripts. As a developer, you can set break points, step over, in, out, continue or cancel code execution. An execution log provides visibility into real-time program feedback, while local variables, watches, expression evaluation add depth to your visibility into code execution.
In addition, NetSuite provides a dedicated domain for debugging as well as a dedicated test environment and debugging domain with the Sandbox.
Benefits of Using SuiteScript Debugger
- Allows for faster interactive development
- Provides an easy-to-use development debugging environment
- Quickly diagnose problems in SuiteScript by stepping through code in real-time
- Ad-hoc debugging mode enables developers to validate code on the fly